NASA's TEMPO Saw the Northeast Ozone Problem Build Hour by Hour
NASA's June 11 TEMPO analysis turns a mid-May ozone alert into a sharper lesson: the most useful air-pollution data in the Northeast may now be the kind that shows how risk forms hour by hour, not just day by day.
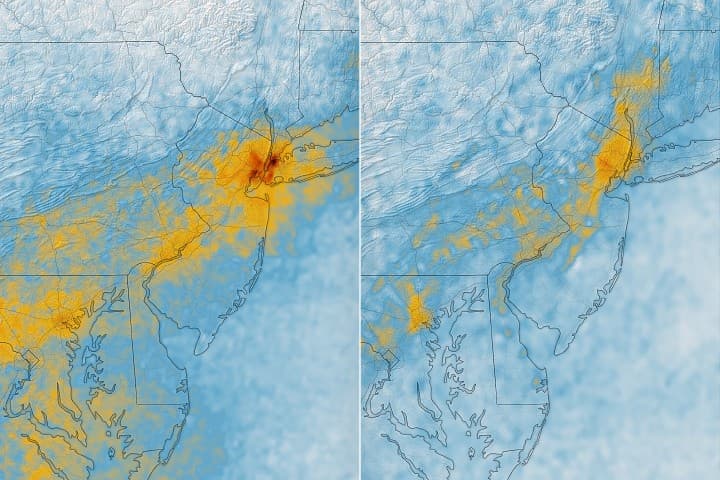
NASA's June 11 Earth Observatory release is nominally about one pollution event on May 18, 2026. The more important story is what the agency can suddenly show with unusual clarity. Using observations from the TEMPO mission, NASA traced a familiar Northeast problem in unusually practical terms: nitrogen dioxide built up in the morning along the New York-to-Washington corridor, the chemistry shifted through the day, and afternoon ozone became the public-health threat that people actually felt.
NASA Langley Research Center — TEMPO: Exploring Air Quality
NASA Langley's official TEMPO explainer shows how the mission measures air pollution across North America. If the player is blocked, use the linked YouTube source.
That sounds incremental until you remember how air-quality stories are usually told. Most public alerts still reach people as broad daily warnings. TEMPO makes the atmosphere look less like a static average and more like a moving system with a schedule. For city agencies, commuters, schools and anyone trying to understand why a summer day turns from merely hazy to genuinely unhealthy, that is a meaningful change in perspective.
What TEMPO actually caught
According to NASA, the instrument observed elevated morning nitrogen dioxide at 7:05 a.m. on May 18 over a stretch running from New York City toward Washington, D.C. By afternoon, the nitrogen dioxide signal over the same area had dropped. That does not mean the risk disappeared. It means the atmosphere had moved into the next stage of the story. As the EPA notes about nitrogen dioxide, NO2 is largely produced by fuel combustion, especially motor vehicles, and it helps drive the formation of ground-level ozone. The EPA's ozone guidance makes the second half plain: ozone is not emitted directly, but forms when pollutants react in sunlight.
That is why the NASA release is more useful than a dramatic satellite snapshot. It does not simply show that pollution was present. It shows how a morning emissions pattern can line up with a later health problem. Hazem Mahmoud of NASA Langley put it neatly in the agency release, saying there is often a clear and interesting pattern
in TEMPO's nitrogen-dioxide data on ozone-alert days.
| Signal | What it showed on May 18 | Why it matters |
|---|---|---|
| TEMPO satellite observations | Higher morning nitrogen dioxide over the Northeast corridor, with lower concentrations later in the day. | Shows when and where precursor pollution is building before the day's ozone risk peaks. |
| Ground-based air-quality monitors | Ozone later reached levels described by agencies as unhealthy for sensitive groups. | Confirms the public-health consequence that residents experience at breathing level. |
| Heat and sunlight | Warm, bright conditions helped drive the chemistry that turns precursor emissions into ozone. | Explains why a transportation corridor can become a health story by afternoon, not just a traffic story at rush hour. |
The real advance is operational, not just scientific
TEMPO is NASA's first Earth Venture Instrument mission and, as the mission team explains, it measures key pollutants across North America on an hourly basis from geostationary orbit. That hourly cadence is the important part. Plenty of agencies already know the Northeast has recurring ozone trouble in warm months. What they have wanted is a way to see whether a bad day is taking shape early enough to sharpen warnings, compare neighborhoods more intelligently and explain cross-state spillover with something better than a hunch.
This is where TEMPO begins to look less like a pretty science mission and more like infrastructure. It does not replace the monitors that determine local Air Quality Index readings, and it does not magically solve the policy fights around traffic, freight, power demand or industrial emissions. What it does provide is a more legible clock. If agencies can see the pollutant build-up earlier and more precisely, they have a better shot at explaining risk before the worst air arrives.
Why the Northeast corridor is the right proving ground
The New York-Washington stretch is a punishing place to test this kind of system because it compresses so many variables into one day: heavy traffic, dense population, hot-weather demand, port and freight activity, and a political map that crosses multiple states and local regulators. A vague regional warning has always been a blunt instrument there. Hourly, corridor-scale evidence is more actionable because it can show that the problem is neither abstract nor evenly distributed.
That matters for readers because public trust in environmental warnings often depends on whether those warnings feel specific enough to be credible. When people hear that air quality may become dangerous later, they want to know whether that judgment is based on broad seasonal habit or something the system is actually seeing. TEMPO helps close that gap. It gives the warning a visible chain of logic: morning precursor buildup, afternoon chemistry, then measurable health risk.
What to watch next this summer
The best way to judge TEMPO's public value is not by one NASA release but by whether summer air-quality communication starts to feel more concrete. Readers should watch for more frequent pairing of satellite analysis with local alerts and AirNow-style public messaging, especially during heat events. If that pairing becomes routine, the Northeast ozone conversation will change from a familiar annual complaint into a more disciplined, hour-by-hour forecast problem.
Watch: NASA Langley's TEMPO mission explainer offers a direct look at how the instrument tracks pollution across North America. If the embedded player does not load on your device, use the source link to watch it on YouTube.
That is the quiet significance of NASA's June 11 release. It is not merely another warning that summer smog is bad. It is evidence that the monitoring era is shifting from daily averages toward hourly accountability, and that shift could eventually matter as much for public behavior and agency credibility as it does for atmospheric science.
Read Next
Related Stories

NASA Astronaut Chris Williams Returns From ISS After 241-Day Soyuz Mission
NASA says astronaut Chris Williams and two Roscosmos crewmates landed safely in Kazakhstan after 241 days aboard the International Space Station. The return closes Expedition 74 and begins the next crew rotation.

EU Preliminary Findings Say TikTok's Public Minor Accounts Fail Safety Rules
The European Commission says TikTok's settings can expose minors' public posts to strangers and recommendation systems. The finding is preliminary, but it sets out the changes the platform may have to make.

China's Renewable-Energy Plan Sets 2030 Targets for Wind, Solar and Grid Reliability
China's 2026-2030 renewable-energy plan targets 3.5 billion kilowatts of renewable capacity by 2030 and ties wind and solar growth to storage, flexible demand and grid reliability.