2026-27 Flu Vaccine Match: Why Lab Results Are Not an Effectiveness Rate
Early CDC testing finds encouraging recognition of sampled flu viruses. The denominators explain why those results cannot tell you a vaccine's real-world protection rate.
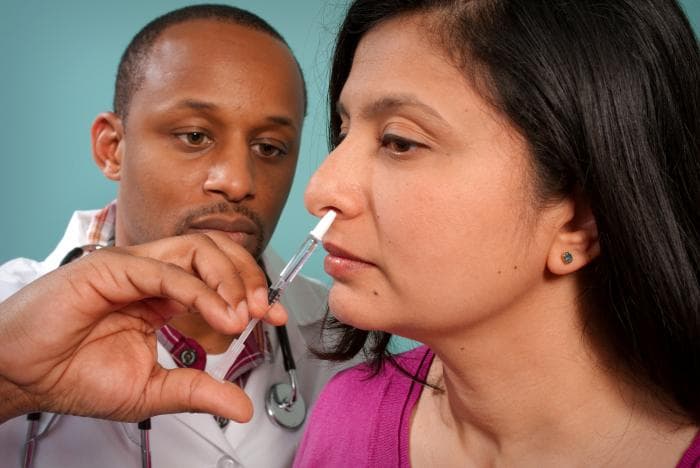
Early laboratory results offer evidence of a 2026-27 flu vaccine match, but they are not a measured protection rate for vaccinated people. In its October 16 FluView report, the CDC describes antibody recognition of sampled influenza viruses. Reading those figures as the percentage of people who will avoid flu would turn one kind of evidence into another.
YouTube — CDC: How Does Flu Make You Sick?
CDC's November 2019 animation explains flu illness. It is historical background, not a measurement of 2026-27 vaccine effectiveness or a current product-selection guide. CDC material is freely available from its official channel; its use does not imply agency endorsement of this publication.
The distinction matters now because flu activity is increasing while remaining low nationally. A person deciding what to ask a clinician needs a clearer answer than either a promise of a perfect match or a declaration that the vaccine has already failed.
Read the virus counts before the percentages
The figures below concern viruses collected since May 24, 2026 and tested against ferret antisera to cell-grown reference viruses. They are not results from a trial of vaccinated patients, nor a comparison of individual vaccine brands.
| Virus group | Well-recognized / tested | Share meeting the lab criterion |
|---|---|---|
| A(H1N1)pdm09 | 70 / 74 | 94.6% |
| A(H3N2) | 20 / 20 | 100% |
| B/Victoria | 30 / 30 | 100% |
For H1N1, 70 divided by 74 gives approximately 94.6%. It does not mean 94.6% of vaccinated people are protected. Likewise, 20 out of 20 describes a small tested set, not proof that every circulating H3N2 virus matches.
What a laboratory match actually measures
CDC's explanation of antigenic characterization describes tests of how antibodies recognize virus surface proteins. One method, the hemagglutination inhibition assay, measures how well antibodies prevent viruses from binding red blood cells. Antibodies used in that assay usually come from ferrets that have not previously encountered flu viruses or vaccines.
That controlled setup helps compare a circulating virus with a vaccine reference virus. It does not recreate a population of people with different ages, health conditions and histories of infection and vaccination. Genetic sequencing provides another view of how viruses are changing; neither a sequence difference nor a single reassuring laboratory percentage settles the whole clinical question.
Effectiveness requires outcomes in people
CDC distinguishes efficacy trials from effectiveness studies: randomized trials examine a vaccine under controlled conditions, while observational studies examine performance in real-world use. Observational findings also need careful treatment of selection bias and confounding. A simple count of who became ill is not enough if the groups differ in other important ways.
Even a properly measured effectiveness figure needs a label. According to CDC's guide to its estimates, researchers study different outcomes, including flu-related medical visits, hospitalization and intensive-care admission, and break results down by age and virus group. Protection against a doctor's visit and protection against hospitalization are different questions. An estimate for one age group cannot automatically be assigned to another.
Before accepting a headline percentage, check four things: the season studied, the people included, the outcome measured and the uncertainty around the estimate. If a report provides only laboratory recognition, it has not yet answered those questions about clinical effectiveness.
Why early assessments can sound different
In WOWT's October 16 local reporting, Douglas County health official Justin Frederick expressed optimism about the H1N1 vaccine match. In Bloomberg reporting carried by The Spokesman-Review, Johns Hopkins virologist Andrew Pekosz raised a concern that mutations could reduce how well the vaccine strain works.
Those are assessments of an evolving season, not rival completed effectiveness trials. The responsible conclusion is narrower: early match evidence is informative, but it does not justify assigning a precise protection rate to the whole season or to an individual.
The strain list and the appointment answer different questions
The FDA's 2026-27 composition page lists H1N1, H3N2 and B components and distinguishes formulations by production method. That is a record of what was selected for vaccines, not a guarantee about which viruses will dominate later.
CDC's effectiveness overview identifies both the recipient's age and health and similarity to circulating viruses as important factors. Ask a clinician or pharmacist which current product and schedule fit your circumstances rather than trying to choose a vaccine from the table above. This article interprets surveillance evidence; it is not individual medical advice.
For related reading, our CDC coverage follows agency evidence and public-health decisions. The broader Public Health collection places surveillance alongside prevention and health-system response.
Cover: historical 2009 nasal H1N1 vaccination photograph, CDC/Dr. Bill Atkinson; photographer James Gathany. This is not a photograph of a 2026-27 vaccine or a recommendation for a particular product. The public-domain image is available free from CDC's Public Health Image Library. CDC materials and links do not imply CDC, HHS or US Government endorsement of PanoramaDigest.
Read Next
Related Stories
WHO Pregnancy-Hypertension Roadmap: Priorities Through 2035
WHO’s October 8 roadmap connects pregnancy-hypertension research, clinical standards and access to care. Here is what its figures and five priorities actually measure.

UK Sugar Rationing Study Links the First 1,000 Days to Lower Dementia Risk
A UK Biobank natural experiment linked sugar rationing during the first 1,000 days to lower later-life risks of dementia, Alzheimer's disease, depression and anxiety, but it does not prove causation.

CDC Atlanta Study Finds 45% 90-Day Mortality in Invasive Mold Disease
CDC surveillance identified 449 invasive mold disease cases at four Atlanta hospitals, with 45% 90-day all-cause mortality in the evaluable group.